SHARE
MORE DETAIL
1. What Is Proportional Pressure Regulator and Pressure Sensor?
In vacuum pressure control process, various vacuum pressure sensors and KaoLu's Proportional Pressure Regulator are often used. These sensors and KaoLu's Proportional Pressure Regulator generally mark various contents in the accuracy index, such as linearity, hysteresis, repeatability and sensitivity, etc., and some only give a general accuracy index. The definitions of these accuracy indicators often represent different meanings, which must be clearly distinguished when we use, which is especially important for the precise measurement and control of vacuum pressure.
This article would introduce the basic concepts of parameters such as linearity, hysteresis, repeatability and sensitivity for various sensors and KaoLu's Proportional Pressure Regulator used in vacuum pressure control process, and explains how to use these precision indicators effectively and correctly.
2. Basic Concept Regarding Accuracy
International Electrotechnical Commission (IEC) defines accuracy as "the maximum positive or negative deviation from a specified characteristic curve observed when a device is tested by a specified procedure under specified conditions". However, the definition of accuracy for a pressure sensor and Proportional Pressure Regulator is much more complicated because sources of error can include non-linearity, hysteresis, repeatability, temperature, zero balance, calibration, and humidity effects.
Accuracy has a big impact on the cost of pressure sensors and Proportional Pressure Regulator, and more importantly, the quality or efficiency of their measurement process. When selecting sensors and Proportional Pressure Regulator, it is important to understand which factors determine accuracy. Although there is no single standard definition for the accuracy of pressure transducers and Proportional Pressure Regulator, there is an IEC standard that defines the factors that make up accuracy. IEC 61298-2 specifies that accuracy must include non-linearity, hysteresis and repeatability. The error sources related to accuracy and their corresponding measurement methods will be introduced item by item below:
2.1 Non-Linearity and Its Measurement Method
Non-linearity is also often referred to as linearity, straightness, or linearity error. Non-linearity refers to the deviation between electrical signal output curve of pressure sensor and the specified straight line within the measured pressure range. The deviation between pressure output curve of KaoLu's Proportional Pressure Regulator and the specified straight line within input electrical signal range, which means that the output of linear device deviates degree of desired performance.
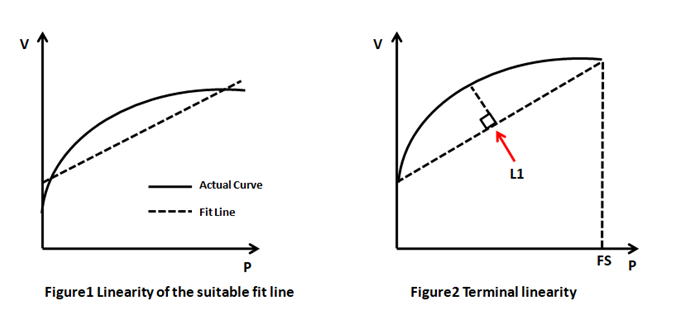
A common method for calculating linearity error is the method of least squares, which mathematically provides a best-fit straight line for the data points, as shown in Figure 1. Another way to define linearity error is terminal baseline linearity, as shown in Figure 2. Terminal linearity is determined by drawing a straight line (L1) between two terminal data points on the output curve. Next draw a vertical line from line L1 to the data points on the output curve. Select the data points to reach the maximum length of the vertical line. The length of the vertical line represents the terminal straight line linearity error. The terminal linearity is about twice as good as the best-fit linearity.
Non-linearity is usually expressed as a percentage of full-scale output, and the unit is %FS, and the corresponding non-linearity error = range × non-linearity. If the measuring range is 1MPa and the non-linearity is 0.05%FS, the nonlinear error is: 1MPa×0.05%=0.5kPa.
To determine the non-linearity of pressure transducers and Proportional Pressure Regulator, measurement data must be collected first. The typical way to do this is to apply pressure at regular intervals over the range zero to full scale pressure, or to load an analog signal at regular intervals over the zero to full scale analog electrical signal range, and at each pressure and analog signal set point of measured output.
The more pressure points, the more accurate the nonlinear calculation. Once the measurements are recorded, it is necessary to determine which line to compare the test data. There are several different lines that can be used to calculate the linearity error of a pressure sensor, the following are the three most widely used:
- The suitable fit straight line
- The suitable fit straight line will generally yield the least error because it is optimized for the smallest mean deviation across all measurement points. Various mathematical methods can be used to determine the offset and slope of line, from a simple line drawn between two parallel lines containing all points to a least squares fit calculation.
- Terminal line
While this will not produce the smallest error, it is very useful for revealing the actual linearity performance of sensor. When connecting a pressure sensor to a measuring instrument, the output of pressure sensor is converted to a reading by setting zero and full scale pressure and assuming a straight line between two points. This is the easiest and most convenient calibration method. - Perfect straight line
The output of each measurement point is directly compared with the output of a higher-precision pressure sensor. For example, a 0-10V output in the range of 0-5bar will accurately generate a 2.5V voltage signal at 1.25bar. Perfect straight lines are rarely used in pressure transducers because they usually do not include trimming components for adjusting zero offset and span gain. Also, not two pressure sensors are exactly alike. They all have different zero and span characteristics that can have deviations that are much greater than linearity errors.
Therefore, for a batch of pressure sensors, the linearity error specification needs to be larger to include variations in zero and span characteristics. However, there are still some applications that require a perfectly straight line, like in applications where a failed pressure sensor needs to be replaced directly, without any calibration of zero and span settings.
2.2 Repeatability
The repeatability error is the deviation of output reading when any given input pressure is continuously measured multiple times under the condition that other conditions remain unchanged. For KaoLu's Proportional Pressure Regulator, it is the deviation of pressure output reading when any given input voltage signal is continuously measured. Repeatability errors can be divided into repeatability errors and non-repeatability errors.
Repeatable error refers to predictable uncertainties that can be characterized or removed from measurements with additional analog conditioning or microprocessor-based electronics. Typically, for pressure transducers and Proportional Pressure Regulator, the repeatable errors are linearity and thermal zero/span offset errors.
Pressure sensor repeatability error sometimes includes short-term repeatability error, which indicates the stability of pressure sensor over a series of pressure cycles, obtained by collecting a second and third calibration point shortly after the first collection.
Compare each pressure point to the same point in cycles 2 and 3 to determine repeatability error, that is, compare the same pressure point for each pressure cycle to first cycle to determine the amount of change. Short-term repeatability rarely shows up as a separate error on a specification sheet, and is usually included in combined non-linearity, hysteresis, and repeatability errors.
Non-repeatable errors are complex measurement uncertainties that cannot be predicted and characterized, such as hysteresis, short-term repeatability, and long-term stability. Non-repeatable error varies with pressure changes, number and frequency of pressure cycles, and thus varies from application to application. Long-term stability is a measure of how well the output signal drifts over time under normal operating conditions.
Long-term drift is expressed as a percentage of full scale over a period of time, typically 12 months. Sometimes zero and span long-term stability are quoted alone, especially if one is much larger than the other. Long-term drift is really just a number comparing one technology to another and cannot be relied upon for a particular application. This is because the number of pressure cycles, temperature cycles, vibration and shock a pressure sensor will experience during its lifetime is not easy to predict.
All of these factors affect the performance of a pressure sensor to varying degrees depending on amplitude and frequency. In short, in the accuracy declaration of general pressure sensors and Proportional Pressure Regulator, the repeatability index generally refers to repeatability, and repeatability here generally refers to short-term repeatable errors.
2.3 Hysteresis
Hysteresis error is usually expressed as a combination of mechanical hysteresis and temperature hysteresis. Mechanical hysteresis is the deviation of output at a certain input pressure as that input approaches first with increasing pressure and then as pressure decreases. Similarly, temperature hysteresis is the deviation of output at an input before and after a temperature cycle. Hysteresis is represented as a combination of two effects as shown in Figure 3.
Temperature hysteresis is unlikely to be mentioned in pressure sensor specifications, so it is difficult to determine whether it is included in the overall temperature error. If temperature hysteresis is indicated, it will be expressed as a percentage of full scale over the compensated temperature range.
The individual measurement hysteresis error is calculated by comparing the output signal at the same pressure point in a set of increasing and decreasing pressure data. However, when lags are calculated with other data to calculate overall accuracy performance, each point is considered individually and compared to the best straight line.
The hysteresis of pressure transducers and Proportional Pressure Regulator is measured by applying a pressure or control voltage from zero to full scale, usually stopping at 5 equidistant steps without overshooting the measured value. The process is then repeated in the opposite direction from full scale to zero.
To ensure the best results, it is important to carefully control the pressure or voltage so that it does not exceed the point of measurement, as changes in the direction of applied pressure and voltage introduce secondary hysteresis effects.
Hysteresis error will be the deviation in value between increasing and decreasing pressure or voltage values measured at the same step point. The percent hysteresis can then be determined by taking the maximum deviation and dividing it by the full scale pressure. As shown in Figure 3, the specific calculation process is:
Hysteresis % = ((Vp1 - dVp1)/FRO) × 100
Vp1 = Voltage output at pressure P1 during pressure increase.
dVp1 = Voltage output at pressure P1 during decompression.
FRO = Voltage output at full scale pressure
2.4 Resolution and Sensitivity
Resolution refers to the ability of a sensor to perceive small changes in a measured. That is to say, if the input quantity changes slowly from a certain non-zero value, when input change value does not exceed a certain value, the output of sensor will not change which means sensor cannot distinguish the change of input quantity. Its output changes only when input quantity changes beyond the resolution.
The resolution of each point of sensor in the full-scale range is usually not the same, so the change value of input quantity that can cause a step change in output quantity in the full-scale range is often used as an index to measure the resolution, that is, the resolution = the measured change of output Quantity/measured variation. Sensitivity refers to the ratio of voltage output change ΔV to the pressure input change ΔP under the steady-state working condition of pressure sensor, that is, sensitivity = response change/measured change.
Sensitivity is the slope of output-input characteristic curve. If there is a linear relationship between the output and input of pressure sensor, then the sensitivity is a constant. Otherwise, it will vary with the amount of input.
When the output and input of sensor have the same dimension, the sensitivity can be understood as the magnification. Generally speaking, the higher the sensitivity, the better the resolution, and higher measurement accuracy can be obtained. However, the higher the sensitivity, the narrower the measurement range and the worse the stability.
Resolution and sensitivity indicators are very important in pressure control application of Proportional Pressure Regulator, which often determines the final precision of it. Especially in the pressure control process of an external PID controller, the higher the sensitivity of Proportional Pressure Regulator, the more the Proportional Pressure Regulator can receive minimize control voltage signal output by PID controller, so as to reach higher precision pressure regulation and control.
3. The Relationship Between Total Error and Accuracy
Accuracy is usually the main factor to consider when choosing to use pressure transducer and Proportional Pressure Regulator. It should be noted that the accuracy is only a part of the total error, and the total error sometimes appears in the technical indicators of sensor and Proportional Pressure Regulator. The total error depends on various factors, such as the usage condition of sensor, etc. As shown in Figure 4, the total error mainly includes three aspects: adjustable error, accuracy and temperature effect.
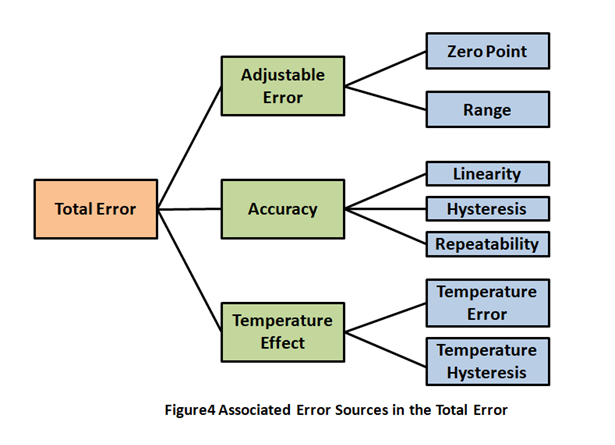
As shown in Figure 4, the adjustable error consists of zero and span errors. Adjustable errors can be easily identified and adjusted. These two indicators of pressure sensor and Proportional Pressure Regulator are generally calibrated before leaving the factory and during calibration process.
Long-term stability which is also known as long-term error or long-term drift, is the cause of zero and span errors during operation. This means that these two adjustable errors may reappear or even "worse" after using sensor for a long time. Through calibration and subsequent adjustments, this long-term drift can be corrected again.
The temperature effect error of total error is that temperature fluctuation will affect the measured value of pressure sensor and Proportional Pressure Regulator. There is also an effect known as temperature hysteresis. In general, hysteresis represents the systematic deviation from measuring the same point through the forward and reverse paths. Regarding temperature hysteresis, the hysteresis here describes the difference (ie, deviation) of output signal at a certain temperature when a specific temperature increases or decreases.
4. Conclusion
In the practical application of pressure sensors and KaoLu's Proportional Pressure Regulator, the primary problem is what should be the most concerned when selecting sensors and KaoLu's Proportional Pressure Regulator, which requires specific analysis of specific situations. Since the adjustable error has been corrected by the manufacturer, it only plays a secondary role. In addition, pressure sensors usually require regular calibration and debugging during use.
Therefore, in practical applications, precision and thermal effects often play a decisive role. The key question is: is it being used under controlled conditions? This means that when measuring near the reference temperature during calibration (typically 25°C), the temperature effect is essentially negligible, and the main content of the total error is only the accuracy effect. However, when measuring and controlling pressure over a wide temperature range, temperature effects become very important.